Re: Help needed to update an OFBiz Wiki Graffle Diagram
Posted by Ron Wheeler on
URL: http://ofbiz.116.s1.nabble.com/Help-needed-to-update-an-OFBiz-Wiki-Graffle-Diagram-tp4659615p4659622.html
URL: http://ofbiz.116.s1.nabble.com/Help-needed-to-update-an-OFBiz-Wiki-Graffle-Diagram-tp4659615p4659622.html
These drawings are easy to make with
Graphviz which is open source
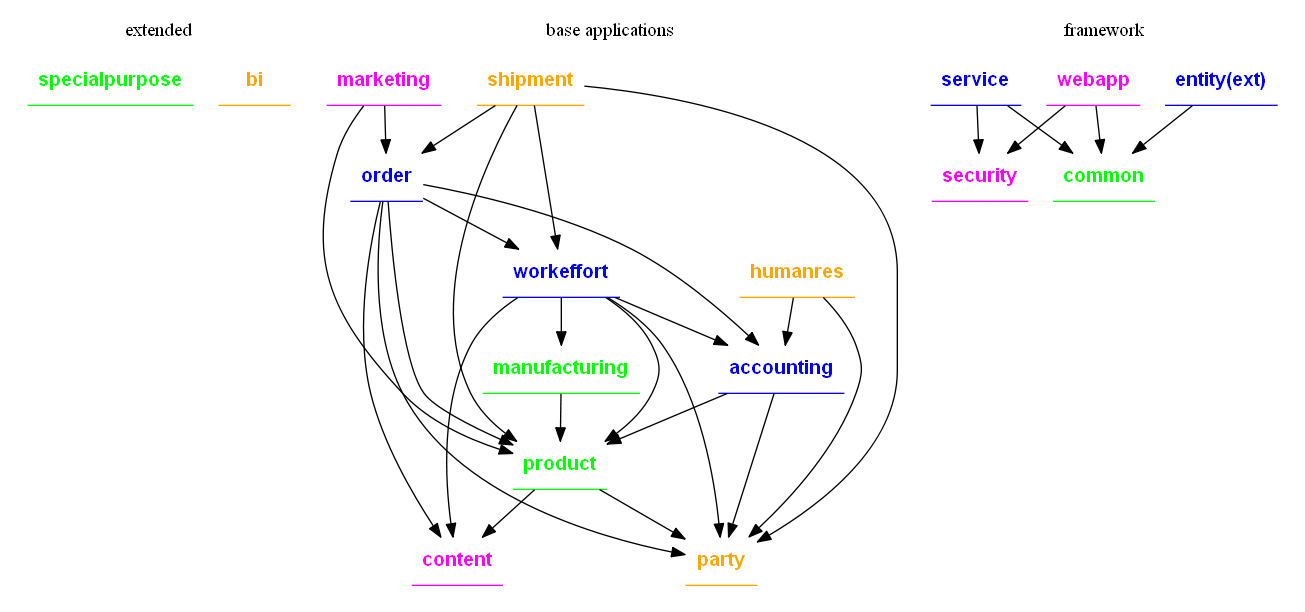
It is also available as a javascript version that can be used to generate graphs dynamically in your browswer by putting the description in an html file;
The graph is created by downloading graphviz from http://www.graphviz.org/Home.php and running the command
dot -Tpng componentDependencies.dot -o componentDependencies.png
The dot file is just a text file with the dot file as follows:
digraph dependencies{
node [shape=underline fontname="helvetica-bold" ];
subgraph cluster01 {
label="extended";
color=white;
bi[color=orange fontcolor=orange];
specialpurpose [color=green fontcolor=green];
}
subgraph cluster02{
label="base applications"
color=white;
node [color=orange fontcolor=orange];
shipment;
humanres;
party;
node [color=magenta fontcolor=magenta];
marketing;
content;
node [color=blue fontcolor=blue];
order;
workeffort;
accounting;
node [color=green fontcolor=green];
manufacturing;
product;
}
subgraph cluster03{
label="framework";
color=white;
node [color=blue fontcolor=blue];
"entity(ext)";
service;
node [color=magenta fontcolor=magenta];
webapp;
security;
node [color=green fontcolor=green];
common;
}
shipment->order;
shipment->workeffort;
shipment->product;
shipment->party;
marketing->order;
marketing->product;
order->workeffort;
order->accounting;
order->party;
order->content;
order->product;
humanres->accounting;
humanres->party;
manufacturing->product;
workeffort->accounting;
workeffort->party;
workeffort->content;
workeffort->product;
workeffort->manufacturing;
accounting->party;
accounting->product;
product->party;
product->content;
"entity(ext)"->common;
service->common;
service->security;
webapp->common;
webapp->security;
}
On 15/12/2014 7:30 AM, Sharan-F wrote:
Hi All

Does anyone in the community have access to Graffle on a Mac who is willing
to help us update one of our wiki diagrams?

The diagram that needs to be updated is called
OFBizComponentDependencies.graffle (see link below)

https://cwiki.apache.org/confluence/pages/viewpageattachments.action?pageId=7766065&metadataLink=true
<https://cwiki.apache.org/confluence/pages/viewpageattachments.action?pageId=7766065&metadataLink=true>

It forms part of the page around Component Set and Component Set
Dependencies page that we want keep up to date.

https://cwiki.apache.org/confluence/display/OFBIZ/Component+and+Component+Set+Dependencies

We need to update some links so please respond if you can help.

Thanks
Sharan


--
View this message in context: http://ofbiz.135035.n4.nabble.com/Help-needed-to-update-an-OFBiz-Wiki-Graffle-Diagram-tp4659615.html
Sent from the OFBiz - User mailing list archive at Nabble.com.
--
Ron Wheeler
President
Artifact Software Inc
email: [hidden email]
skype: ronaldmwheeler
phone: 866-970-2435, ext 102
| Free forum by Nabble | Edit this page |